

Monitoring
If you click into a Vault, you will see a Monitoring button in the top-right corner. Clicking it
opens a Grafana dashboard which offers various analytics into the performance of this particular
Vault, such as:
- First Token Latency
- Queuing Latency
- Average GPU Duty Cycle
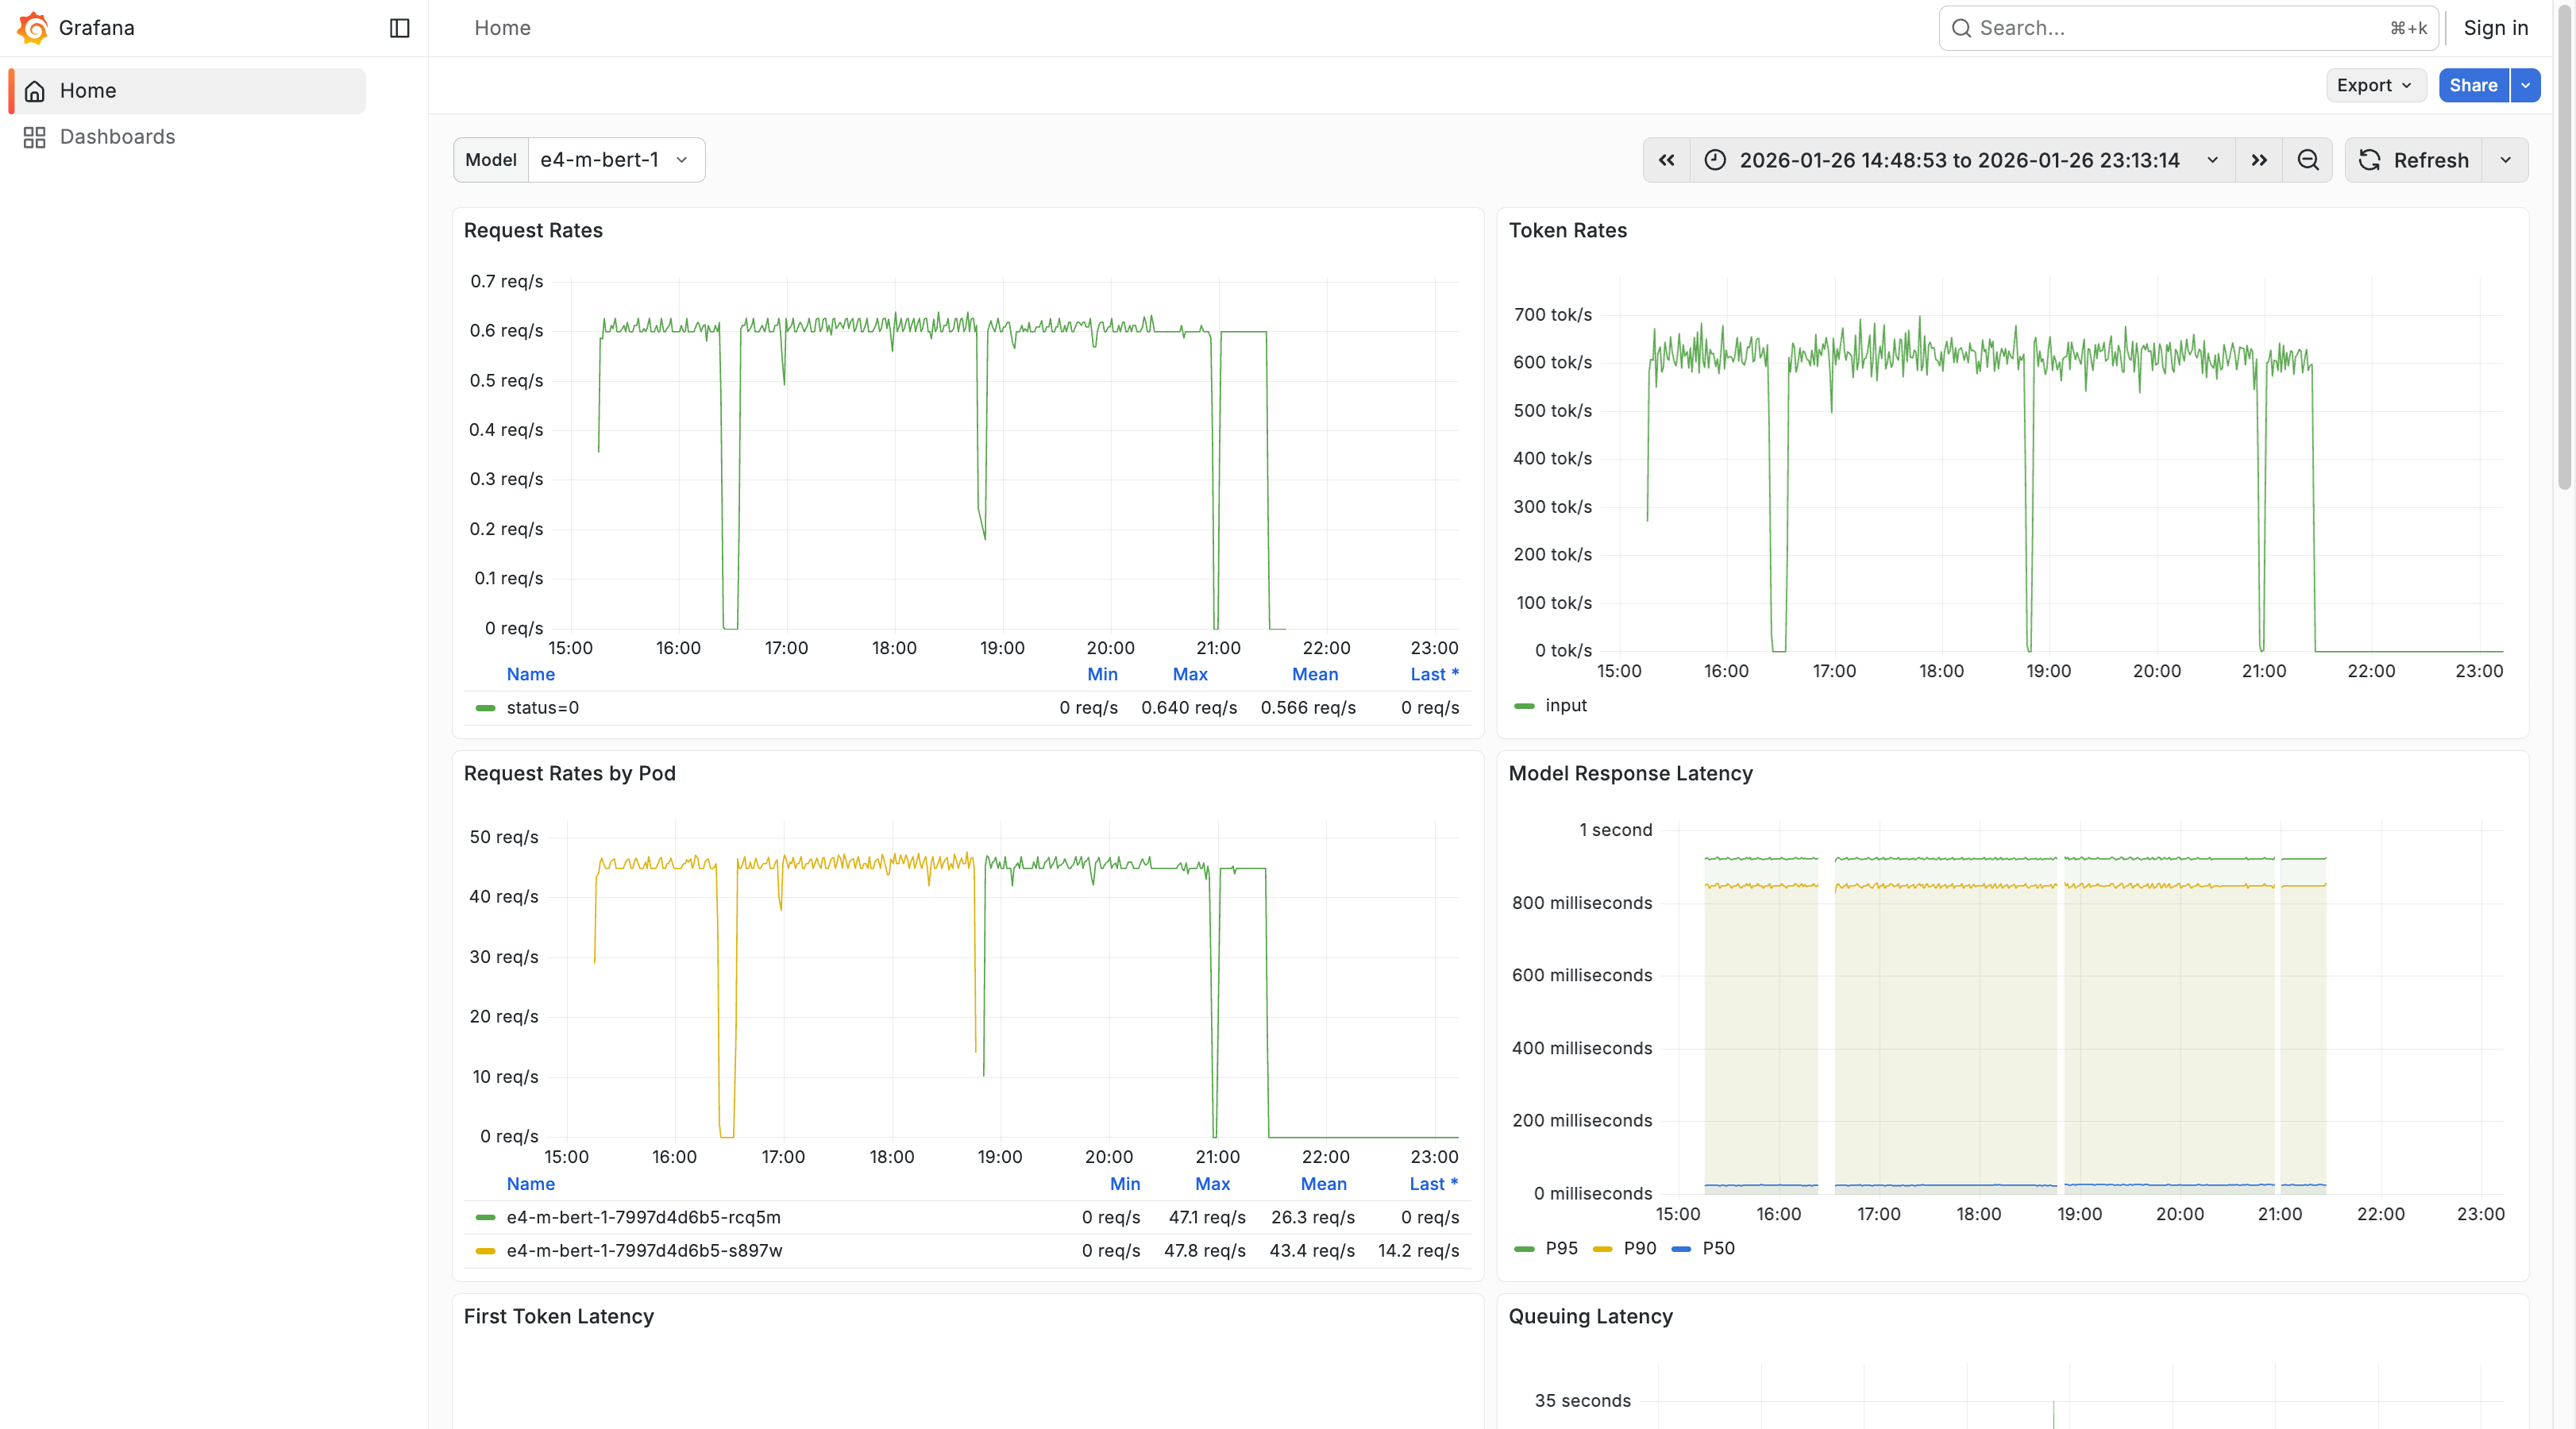
This lets you gather analytics related to specific models, modify the time range over which your analytics are gathered, inspect various on-page graphs, or export and share your data.
You can change the model with the Model dropdown in the top-left corner, use the Search bar at
the top of the screen to find particular pieces of information quickly and easily, and refresh your
data by clicking Refresh at the top of the screen.